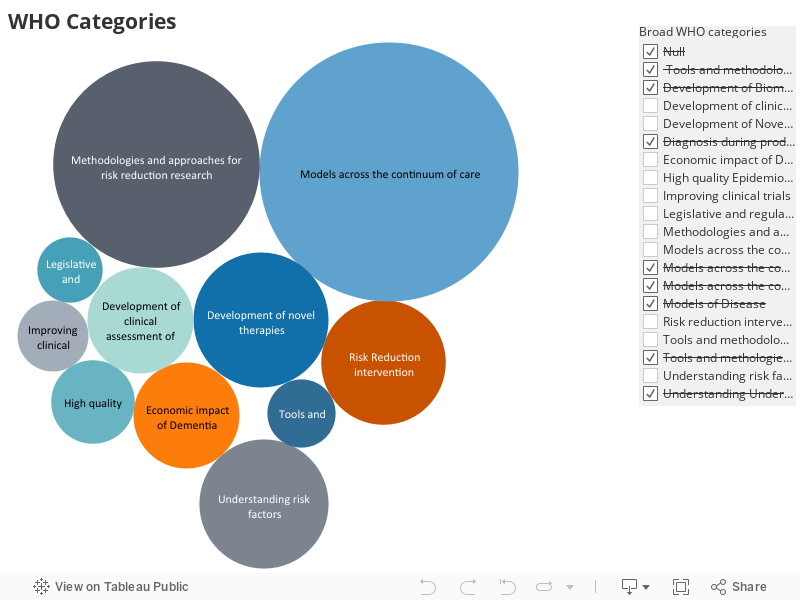
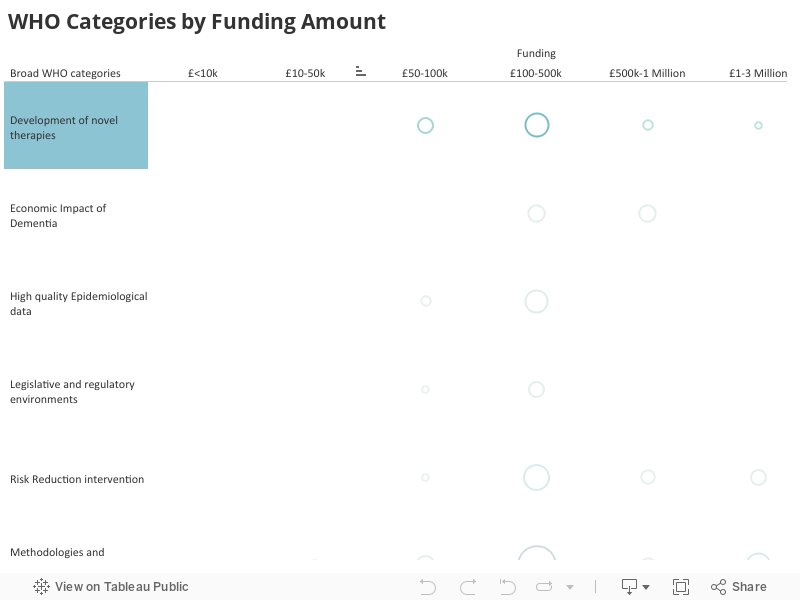
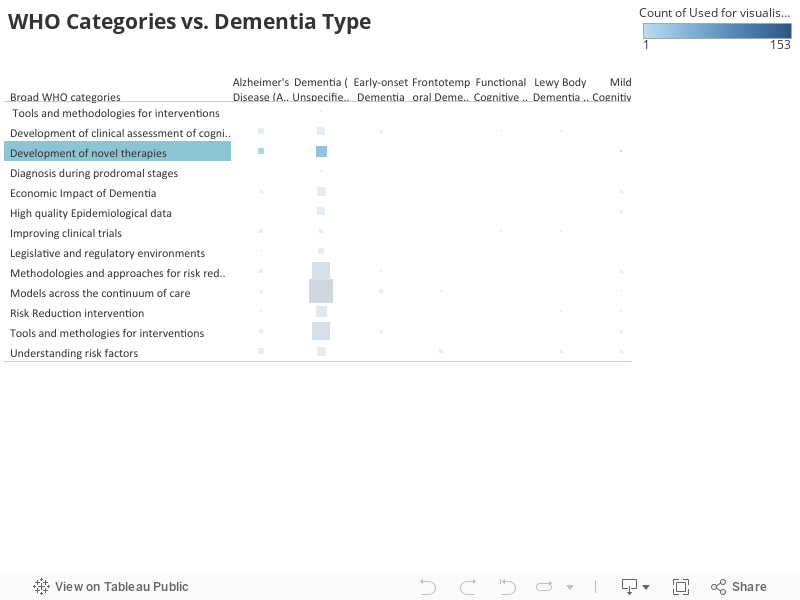
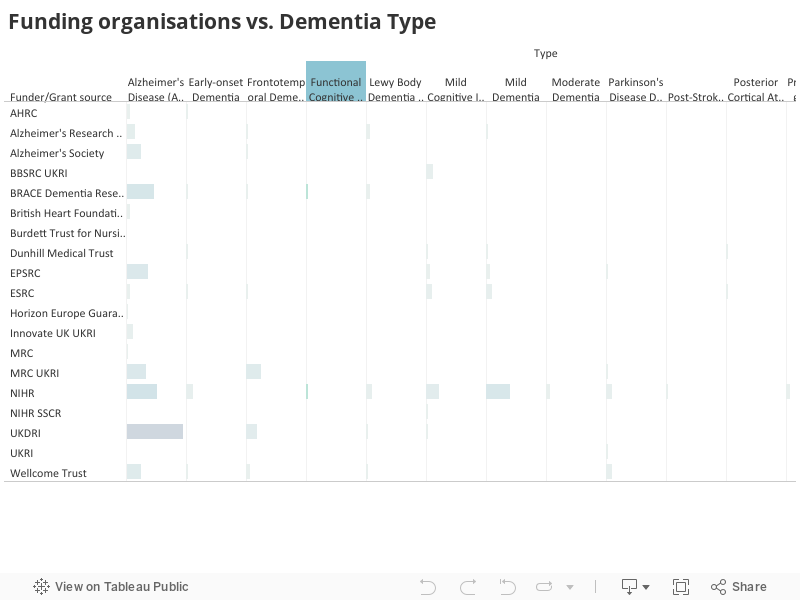
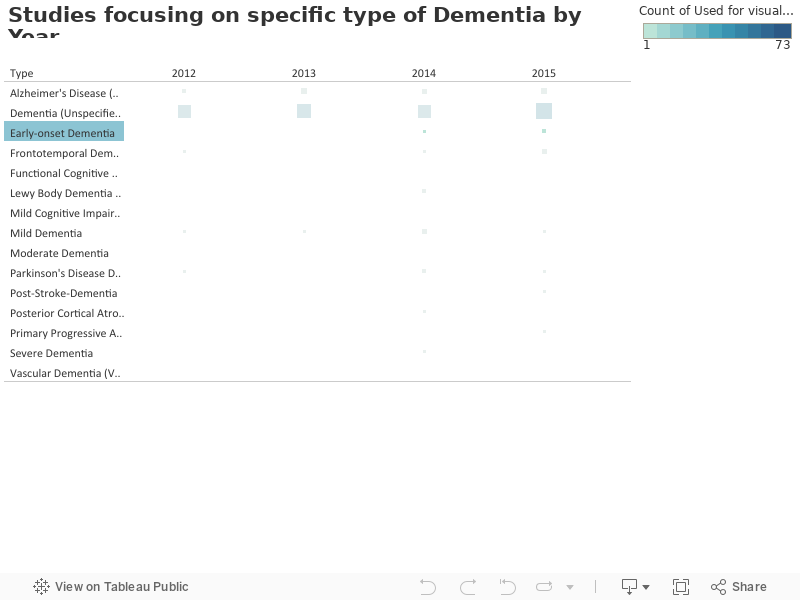
Map Visualisations
As we pulled the Dementia Map together, we have also used this database of 810 projects to develop an overview of the research landscape, which provides insight into the most-funded research areas, which bodies are funding research, and how this has been distributed over time. The Tableau visualisations below illustrate this data.